
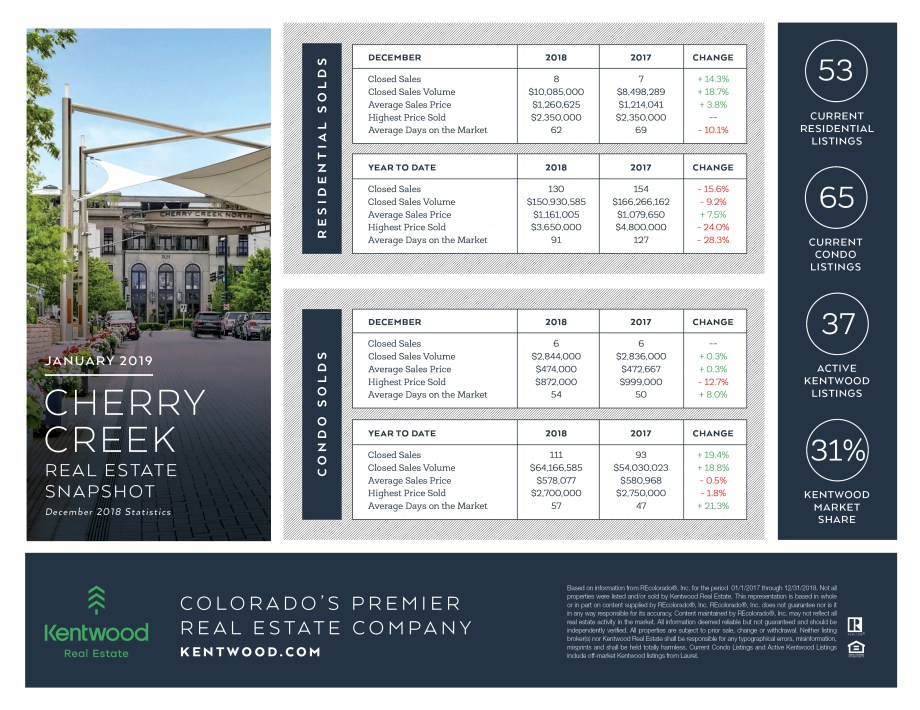
Cherry Creek
December was a bit slow for Cherry Creek, which is typical for the time of year, with 8 residential properties and 6 condos closing. The volume for residential properties was up 18.7% in December, but down by 9.2% for the year overall. Average price was up – by 3.8% in December and 7.5 % YTD. Highest price was the same in Dec ’17 and ’18 but decreased by 24% YTD – buyers take notice!!
The condo market in Cherry Creek saw 6 sales each for Dec ’18 and ’17, and volume and average price was almost flat for the month of December. Highest price decreased by 12.7% and DOM increased by 8%.
Condos YTD show a different picture with around a 19% increase in both closed sales and volume, while average price was down by 0.5% and highest price by 1.8%. Condos stayed on the market 57 days in 2018 vs. 47 in 2017.
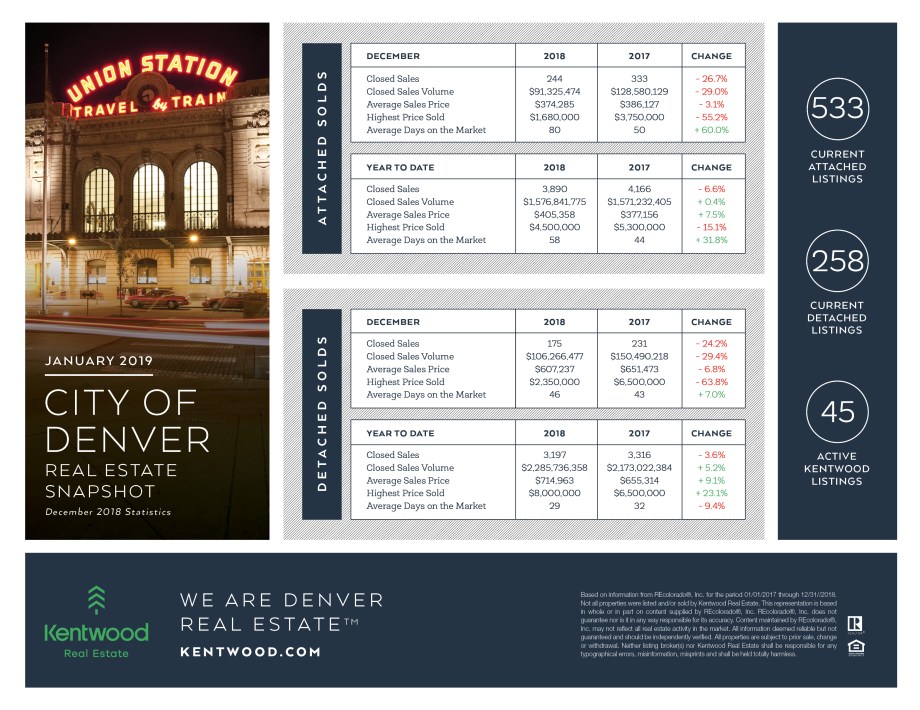
The City of Denver
December 2018 slowed down a lot compared to a year prior. Looking at attached properties, the number of sales was down 26.7%, volume 29%, average price by 3.1%, and highest price by 55.2%. This was coupled with a 60% increase in DOM!
Detached properties showed a similar picture with a 24.2% decrease in sales, 29.4% in volume, and 6.8% and 63.8% decrease in average and highest price, respectively. However, the increase in DOM was only 7% so not nearly as extreme as for attached properties.
Year to Date for the City of Denver is much less drastic with attached properties showing a slowdown of 6.6.% for sold units, but a 0.4% increase in volume and 7.5% in price. However, the highest price sold decreased by 15.1% and DOM increased by 31.8%.
Detached properties also sold fewer units YTD compared to 2017, or 3.6% less while volume was up 5.2%, and an increase of 9.1% and 23.1% for average and highest price, respectively. Highest price and DOM show an inverted trend compared to the month of December, with highest price increasing by 23.1% and DOM decreasing by over 9%.
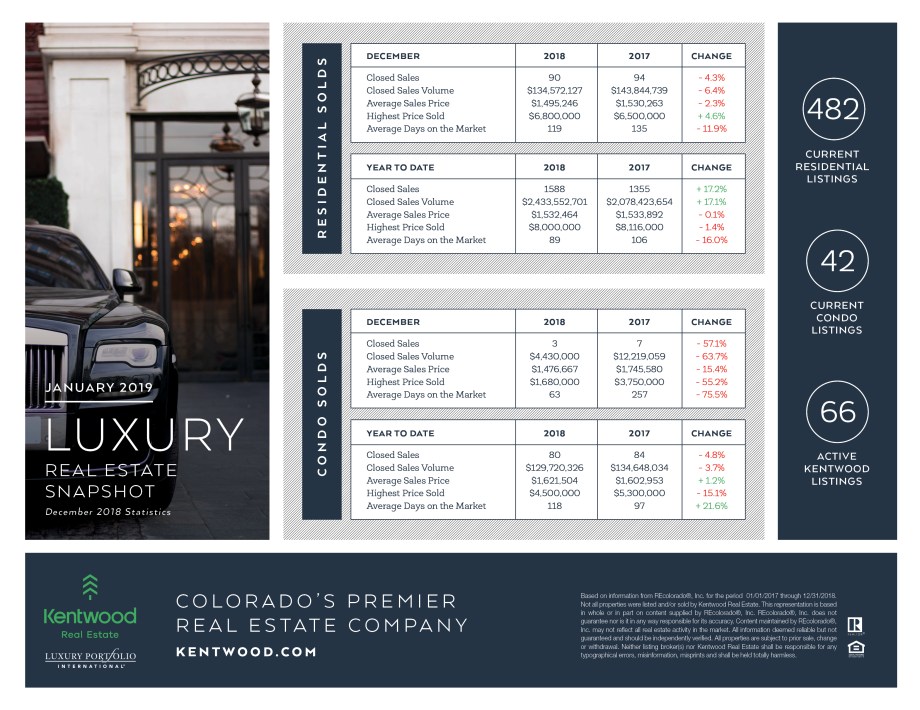
Luxury Real Estate
The luxury residential market was a bit slower for December 2018 compared to 2017. Closed sales were down 4.3%, volume by 6.4%, and average price by 2.3%. Highest price sold increased by 4.6% at $6.8M and properties sold almost 12% faster.
Looking at YTD, there was about a 17% increase in number of sales and volume and average price was basically flat, and with a slight decrease of 1.4% in highest price sold and 16% decrease in DOM, 2018 was a very strong year for residential luxury properties.
Luxury condos sold MUCH faster in December 2018 than in 2017, or a 75% decrease! However, everything else was significantly down for that time period: 57.1% for closed sales, 63.7% for volume, 15.4% for average price, and 55.2% decrease for highest price.
Year to date was a bit more stable, but still saw a decrease in both sales and volume – by 4.8% and 3.7%, respectively. Average price was up slightly, or by 1.2% while highest price dropped over 15% and DOM went from 97 to 118.
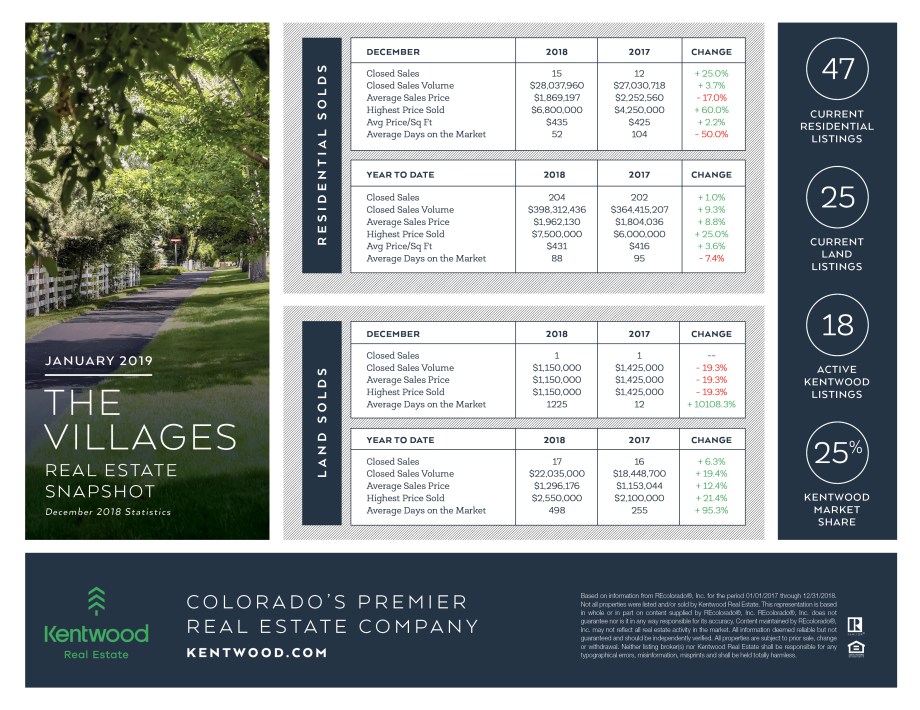
The Villages
The Villages continued to do well with residential properties in December. The number of sales increased by 25%, although volume only went up 3.7%, which can be explained by the 17% drop in average price. However, highest price went up 60%, and average price per square foot by 2.2%. Properties sold 50% faster with DOM at 52!
Year to date was also positive with sales increasing by 1%, volume by 9.3%, average price by 8.8%, highest price by 25%, and average price per foot by 3.6%. Days on market decreased by 7.4% for the year.
Looking at land sales in the Villages, there was only one sale in both Dec ’18 and Dec ’17, and sold for a 19.3% less price after sitting on the market for 1225 days.
The Villages showed a slower but very positive market for land sales for the year overall. Closed sales were up 6.3%, volume by 19.4%, average price by 12.4%, highest price sold by 21.4% and DOM increased 95.3%.
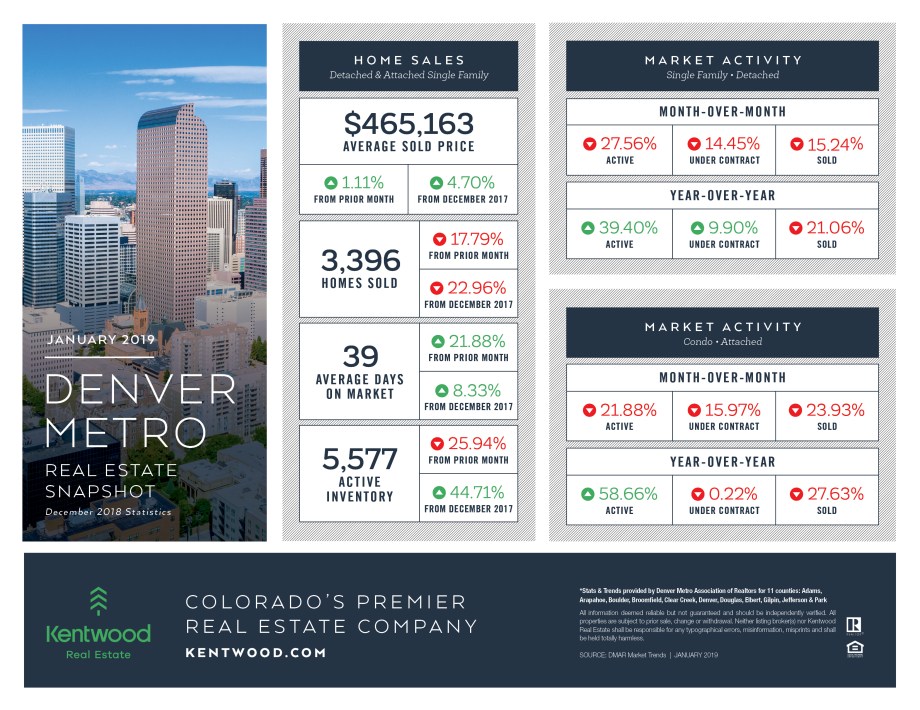
Denver Metro
Denver Metro saw the average sold price rise 4.7% from December 2017, but with much fewer homes sold (23% decrease!) This correlates with an increase in active inventory, with 44.71% more homes on the market than in December 2017.
![]()
