
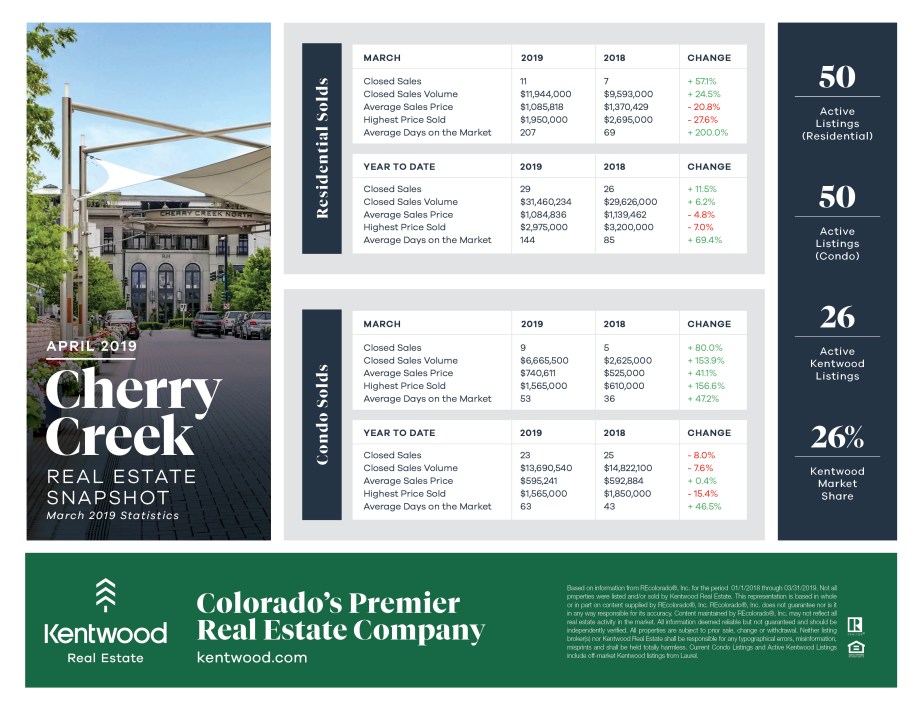
Cherry Creek
Year to date and the month of March are showing the same trend for residential solds, with more volatility for just March then the past three months combined.
In March, the number of closed sales and volume were up; by 57.1% and 24.5% respectively. Average, and highest price sold, however, were down – by 20.8% and 27.6% respectively. The average days on market jumped from 69 days in March 2018 to 207 this year.
Looking at year to date the increase in closed sales was 11.5%, and 6.2% for sales volume. Average price decreased by 4.8% during Q1, and highest price by 7%. The average DOM jumped by almost 70%, but at 144 days, the three-month average is lower than what we saw for just March.
This tells me that the market finally agreed that Cherry Creek has been a good buy lately, and buyers started closing on these properties.
The condo market in Cherry Creek was very strong in March with closed sales up 80%, volume by 154%, average price over 40%, and highest price sold by 156.6%! The only negative was properties taking longer to sell; with DOM going from 36 to 53 days, which is still just a fraction of what we saw for residential properties.
Year to date for condos looks very different than March for most metrics. Closed sales decreased by 8%, or two properties, with almost the same decrease for closed sales volume. The average price was almost flat at a 0.4% increase, and highest price decreased by 15.4%. Average DOM is at 63 days vs 43 days for the same time last year.
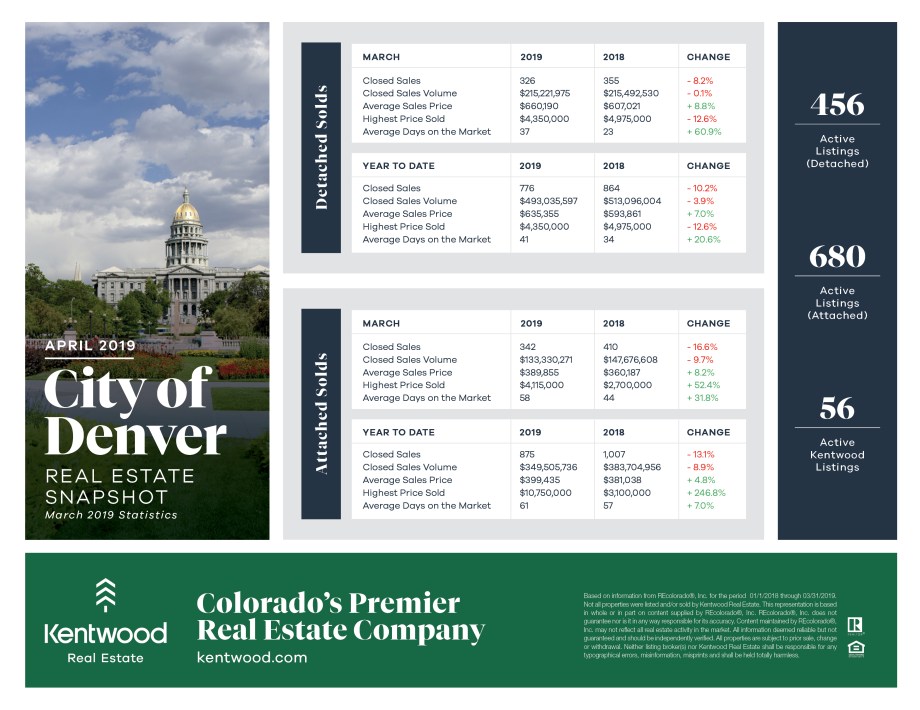
The City of Denver
The City of Denver shows the same trend between March, and Q1 as a whole, both for detached, and attached properties.
With detached properties in March, we see a decrease of just over 8% in closed sales, while volume is virtually unchanged at a 0.1% decrease. The average price continued to grow, at almost 9%, but highest price sold in March was down 12.6%. Average DOM jumped 70%, but are still only at just over a month.
Year to date for detached properties shows a 10.2% decrease in closed sales, and almost 4% decrease in volume. Average price is up 7% compared to Q1 last year, and highest price, like for March is down 12.6%. There’s less of a jump in average DOM, or 20%, leaving it at 41 days on average for the quarter.
Attached solds in the City of Denver in March had a 16.6% decrease in sales and 9.7% in volume. Average price is up 8.2%, highest price 52.8%, and DOM is up almost 32%.
For the first quarter, attached properties had a 13.1% drop in closed sales and 8.9% drop in volume. Average price increased by 4.8%, highest price by 247%, and average DOM had a modest increase of 7%.
This shows a healthy market overall for the City of Denver. While there were slightly fewer sales of detached properties, average price still shows a healthy gain and while properties took longer to sell, looking at the big picture the DOM shown are still low. We are getting into the busiest season of the year with less frenzy than in 2018, which is a good thing. The overall conclusion is the same for attached properties, but there’s a bit of a difference in the supply/demand relationship as the decrease in sales was larger, and DOM are higher than for detached properties.
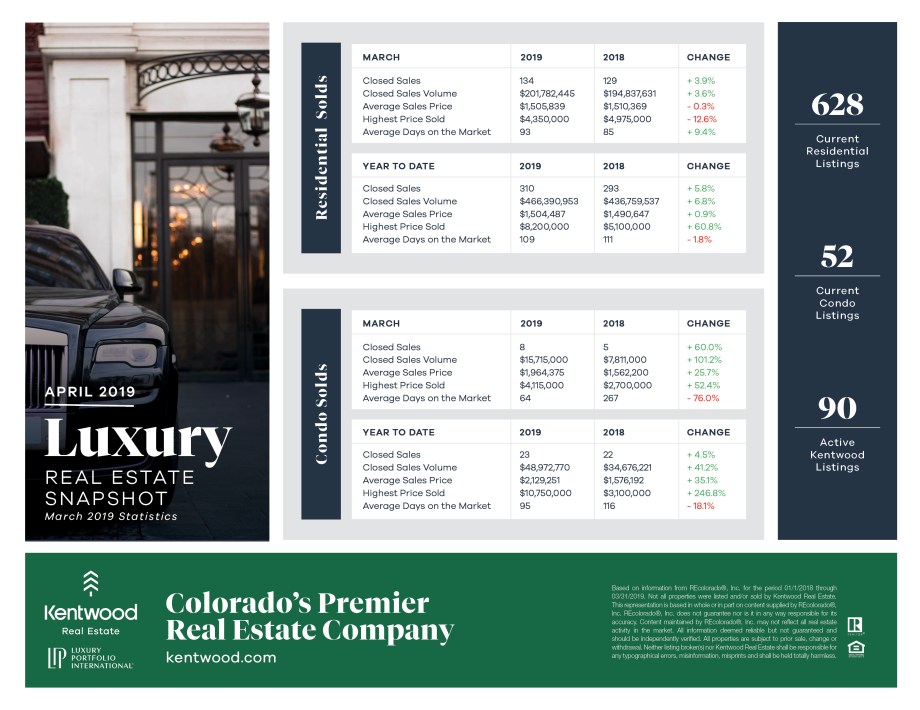
Luxury Real Estate
The luxury market for residential properties was pretty mellow for March. The number of closed sales increased by almost 4% and volume by 3.6%, and average price remained very stable at a 0.3% decrease. The highest price sold dropped by 12.6% and average days on market increased by 9.4% to 93 days.
The first quarter showed the same direction for closed sales and volume; increasing by 5.8% and 6.8%, respectively. Just like in March, the average price was stable at 0.9% increase from last year. The DOM was almost unchanged, going from 111 to 109 days.
Luxury condos shows much larger figures in March then residential properties did, but we are also talking about an increase in closed properties from 5 to 8 properties, which translates into 60%, as well as a just over 100% increase in closed sales volume. There was a very healthy increase of 25.7% in average price, and 52.4% in highest price sold. Luxury condos sold much quicker in March 2019 than a year ago with a 76% decrease in average days on market.
Looking at Q1 as a whole for luxury condos, closed sales went from 22 to 23, and the volume increased by 41.2%. Similarly, average price increased 35.1% and highest price sold was a record breaking $10,750,000, vs. $3,100,000 for Q1 2018.
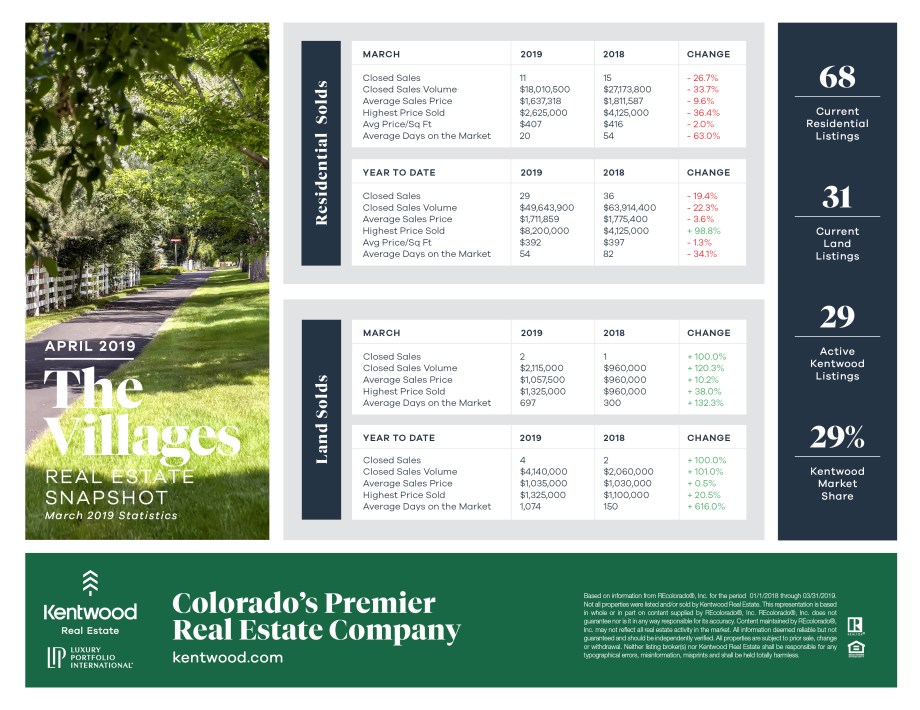
The Villages
Looking at the statistics for the Villages gives a strong visual at a quick glance – all (almost) red for residential properties, and all green for sold land!
Breaking it down further, let’s start with residential properties. In March, closed sales dropped by 26.7%, and volume was down 33.7%. Average price saw an almost 10% decrease, and highest price sold dropped 36.4%. Average price per square foot was pretty stable, with a 2% decline from March 2018. The one number we want to see in red – average days on market, was down 63%, and is currently at only 20 days.
Year to date shows the exact same trend, although the numbers are a bit different, with a huge exception in highest price sold, which was at $8,200,000 in Q1, almost a 100% increase from Q1 2018.
Land sales increased from 1 to 2 for the month of March, with volume showing a 120% increase, average price 10.2%, and highest price sold by 38%. Average days on market was at 697 for March, or almost two years; up by 132% from a year ago.
Looking at Q1, there was also a 100% increase in closed sales – from 2 to 4, and volume was up by the same percentage. Average price was basically the same, with a 0.5% increase, and a 20.5% increase in highest price sold. Average DOM was up 616% for the quarter, sitting at 1074 days.
Overall this shows that land is moving, and the prices are favorable to sellers, but it takes an extremely long time on average to find buyers.
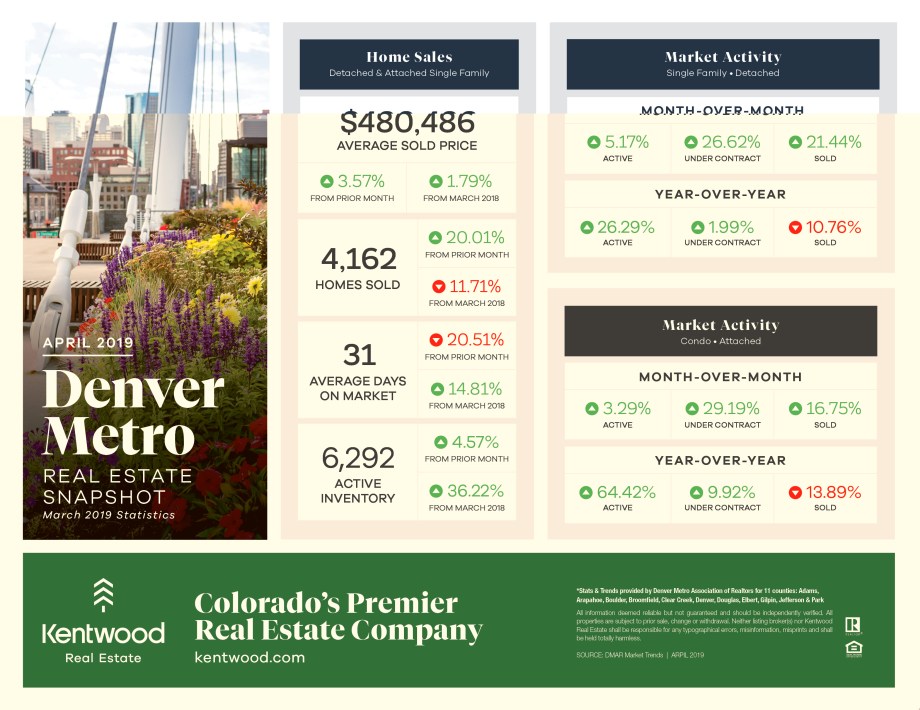
Denver Metro
The Denver Metro statistics showcase that while prices are still rising in the area from a year ago, the pace is slowing down – the average sold price for the metro area is up 1.79% from March 2018. Furthermore, fewer homes were sold, they spent more time on the market, and we have more inventory. However, it’s crucial to remember that the numbers we are comparing to are so extreme – a lot of homes were sold, extremely quickly, and inventory was practically non-existent, so the percentages don’t tell the whole story.
![]()
