
Cherry Creek
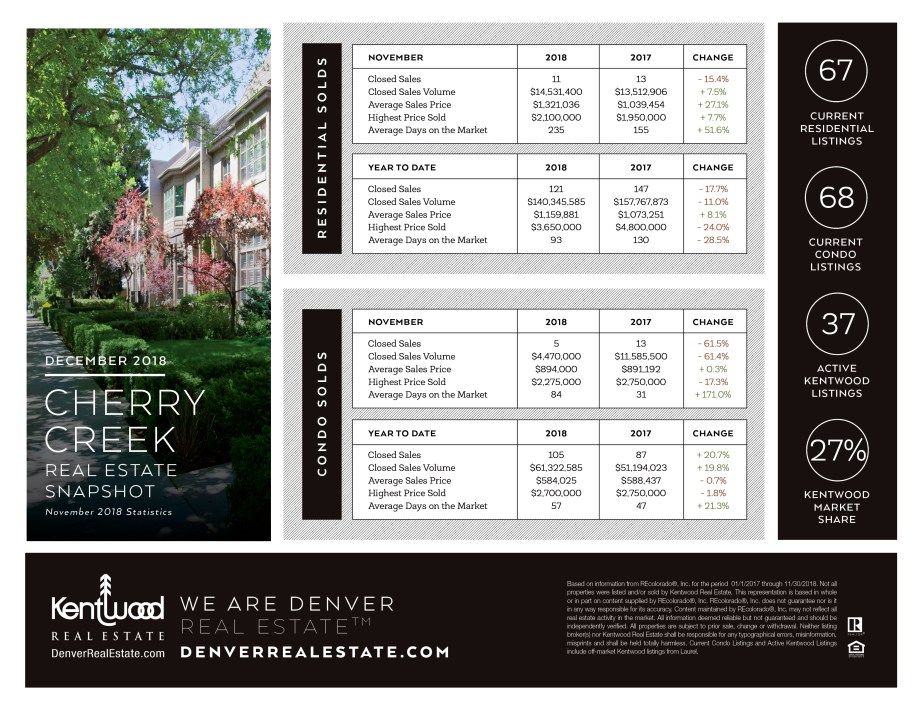
Cherry Creek residential properties were HOT in November! While number of closed sales was down by 15.4%, the volume increased 7.5%, average price by over 27% and highest price sold by 7.7%. However, sellers had to be patient to get those prices as average DOM increased by 51.6% to 235 days.
Closed sales YTD decreased by 17.7% and volume by 11%, while average price showed a 8.1% increase. Highest price sold was down 24% and DOM decreased by 28.5%, showing that the slowdown in how fast properties move was much more specific to November rather than a year long trend.
Condos in Cherry Creek differ quite a bit from what we saw above. November showed a drastic decrease in number of closed sales and volume at over 61% drop for each category. Average price was almost flat at a 0.3% gain from November 2017, and highest price sold was down 17.3% with DOM increasing a lot at 171%, but it’s still only at 84 days or much less than residential properties in the area.
For YTD, condos in Cherry Creek did pretty well so far, with closed sales increasing by 20.7% and volume by 19.8%. Average prices were stable at a 0.7% decrease and highest price was down 1.8%. Average DOM went from 47 to 57.
The City of Denver
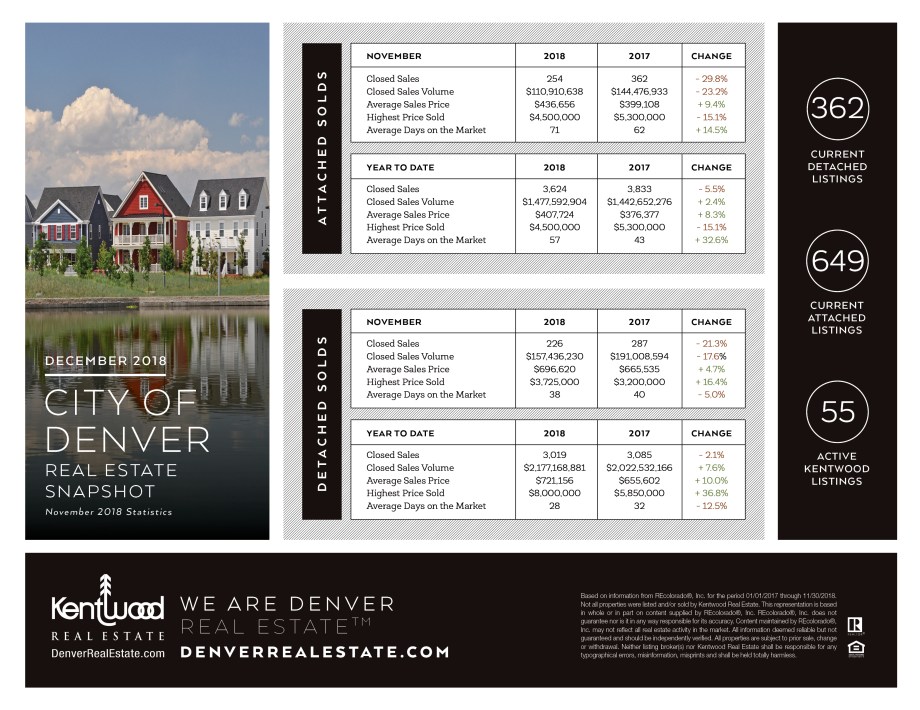
There has been a lot of talk that the market is slowing down, and when it comes to number of closed sales and volume we certainly see a slowdown from November last year.
Attached properties in the City of Denver had an almost 30% decrease in closed sales, and 23.2% decrease in sales volume compared to November 2017.
However, average price is still up 9.4% but highest price is down 15.1% and properties take longer to sell with an average DOM up 14.5% and at 71 days is now well over 2 months.
Looking at year to date for attached properties, the City of Denver shows a 5.5% decrease in number of sales, but a 2.4% increase in volume, and 8.3% increase in average price for the same period last year. Highest price sold has the same data as the month of November – down 15.1% and average DOM increased 32.6%.
Detached properties in the City of Denver showed a similar trend for number of closed sales, volume and average price as attached properties, but the complete opposite for highest price sold and DOM, both for Novermber and YTD.
For the month of November, closed sales were down 21.3% and volume by 17.6% from a year ago, but average price increased by 4.7%. Highest price sold jumped 16.4% and DOM decreased by 5% and currently sits at 38 days, so single family homes are still selling quickly in Denver.
Year to date shows closed sales decreased by 2.1%, while volume was up 7.6% and average price by 10% – a strong gain from last year. Highest price sold saw a large increase of almost 37% and properties have average DOM of 28, down from 32 last year.
Luxury Real Estate
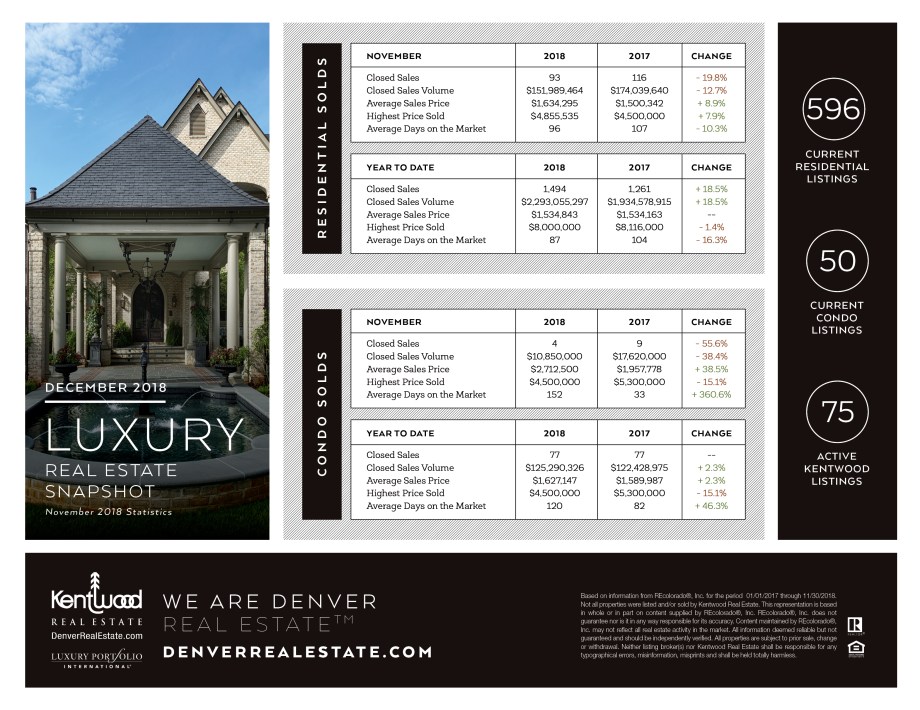
Residential luxury properties continued to show price increases in November, with average price up by 8.9% and highest price by 7.9%. However, fewer properties sold with closed sales down by 19.8% and volume by 12.7%. Average DOM decreased by 10.3%.
Luxury properties year to date showed an 18.5% increase in both closed sales and volume and average price staying completely flat and highest price dipped slightly by 1.4%. Average DOM are at 87 days, or 16.3% less than same time last year.
Luxury condos had a slower November for sales and volume; down by 55.6% and 38.4% respectively, but average price was up 38.5%. The highest price decreased by just over 15.1% and DOM showed a huge increase of 360.6% and is up to 152.
Looking at year to date the number of sales was at 77 in 2018 and 2017, with volume and average price both increasing by 2.3%. Highest price showed the same figures as November and DOM increased 46.3%.
The Villages
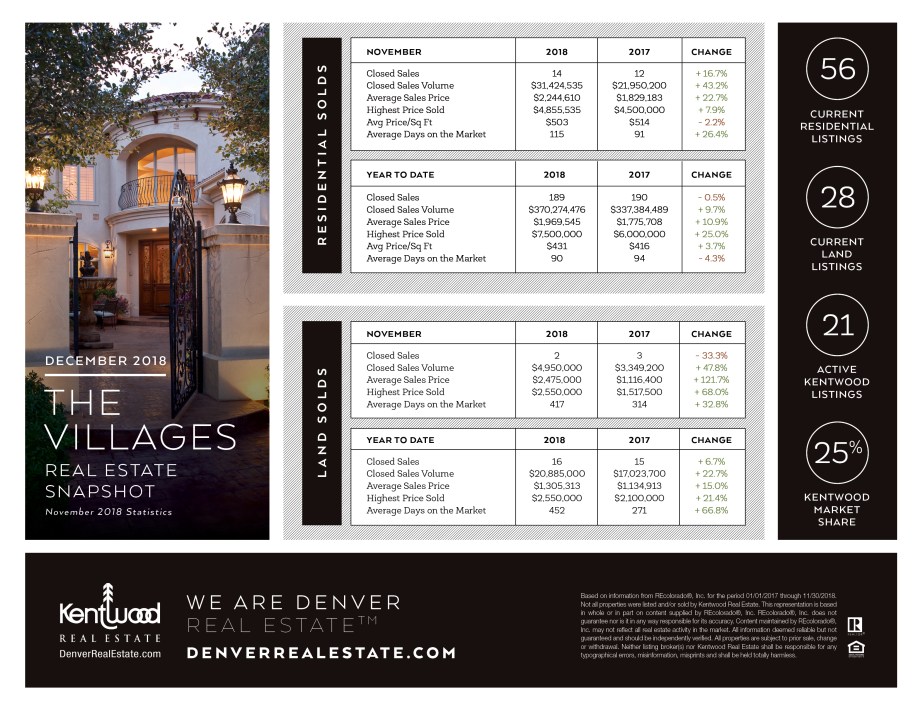
The Villages had yet another strong month in November with closed sales up by 16.7%, volume by 43.2%, average price by 22.7% and highest price by 7.9%! Average price per square foot was down slightly by 2.2% and average days on market increased by 26.4% and are now at 115 days.
Year to date in the Villages was almost flat for number of closed sales – 189 vs. 190 last year. Volume increased by 9.7%, average price by 10.9%, highest price by 25% and average price per square foot by 3.7%. Days on market lowered from 94 to 90 currently.
Land sales in the Villages went from 3 sold properties in November 2017 to 2 this past month but prices were much higher. Volume increased by 47.8%, average price by 121.7% and highest price 68%. These sales did take longer to come together as DOM increased by almost 33%.
Looking at YTD for land the numbers are green across the board, which is great except for average days on market.
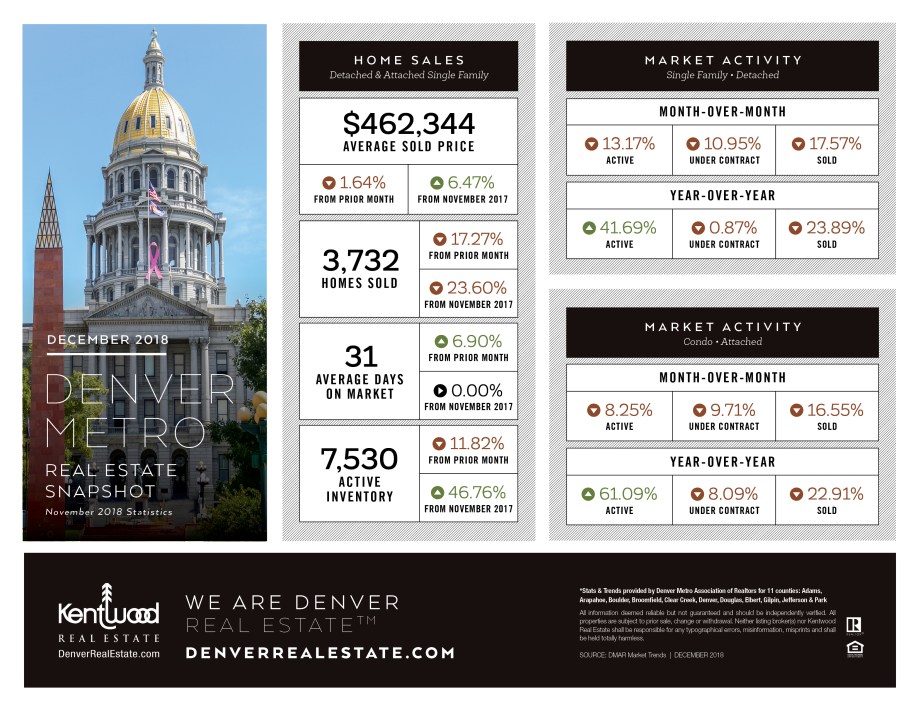
Denver Metro
The Denver Metro area continues to see average price rising year over year, with a 6.47% increase from November 2017 sitting at $462,344, which is a slight decrease of 1.64% from October 2018, which is pretty typical. However, fewer properties are selling and there´s a huge increase in inventory – 46.76% – year over year! Days on market remain at 31 days, which although it´s more than in October, is still a quick selling market.
![]()
