Cherry Creek
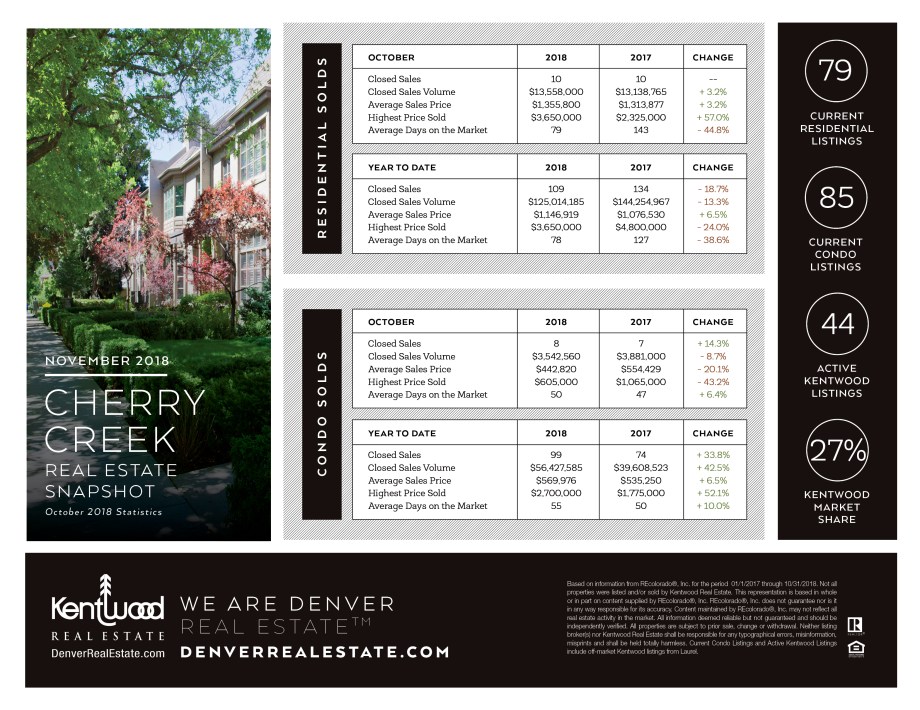
I’ve been saying this for a while now, but the statistics support this – there are some great buying opportunities to be made in Cherry Creek! That being said, it’s not so drastically changing price wise that sellers have to despair.
Residential properties in Cherry Creek saw the exact same number of properties sold in October this year as in 2017 – 10 homes. The sales volume and average price were both up 3.2% and highest price sold saw a 57% increase but with only 10 homes that number can fluctuate a lot.
As we saw in September properties are selling quicker with almost a 45% decrease in DOM.
Looking at YTD for residential properties in Cherry Creek both number of closed sales and sales volume are down; by 18.7% and 13.3% respectively, while average price is up 6.5%.
Highest price sold is down by almost a quarter but properties are selling 38.6% with current average DOM for the year at 78.
Cherry Creek condos show an increase from 7 to 8 condos sold in October vs. last year, with volume down by 8.7% and average price by 20.1%. Highest condo price sold in October was down over 43% and properties took 6.4% more days to sell. However at current DOM of 50, condos are still selling faster than residential properties.
Condos in Cherry Creek YTD are show all categories up for the period. Number of closed sales is up 33.8%, volume 42.5%, average price 6.5%, and highest price by 52.1%. Days on market increased by 10% and is at 55 days for the year so far.
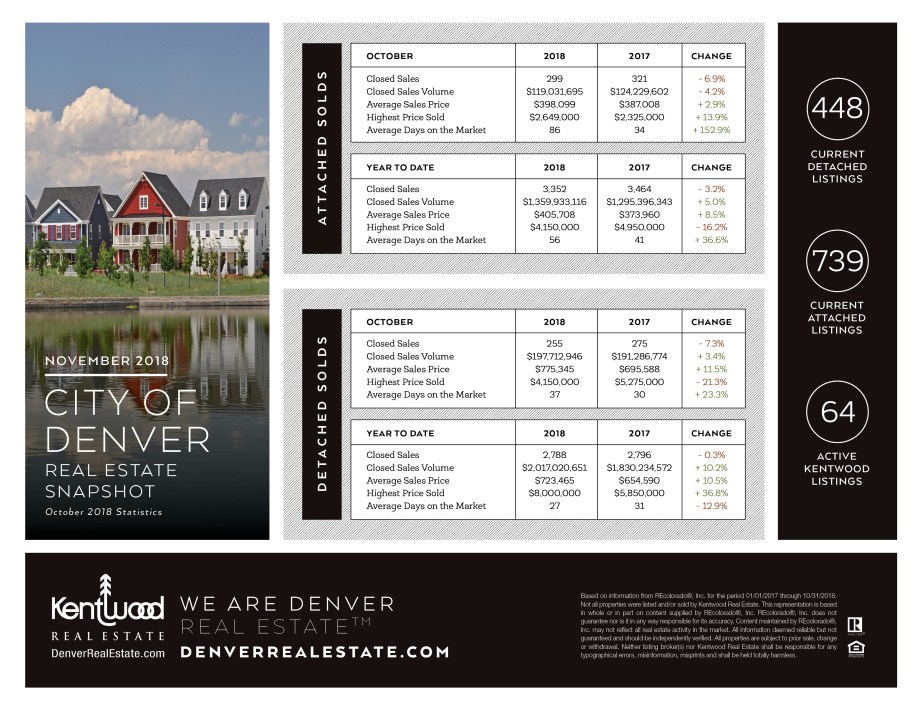
The City of Denver
Looking at attached properties in the City of Denver specifically for October we can see that fewer properties are selling than in October 2017. Number of sales were down 6.9% and volume by 4.2%. Prices did see an increase of 2.9% on average and almost 14% for the highest price sold. However, properties are sitting on the market due to the increased inventory and now take almost 3 months on average to sell vs. just over a month in October last year.
Year to date also has a decline in the number of sales closed of 3.2% but volume did increase by 5%. Average sales price was up by 5% but highest price down by 16.2%. Days on market are also up for the YTD but not as drastically as for October and sits at 56 days.
Detached properties in the City of Denver show a similarity to attached ones in some categories but not across the board.
Closed sales are down by 7.3% in October compared to October 2017, but volume is up 3.4% and average price by 11.5%. Highest price sold decreased by over 21% and DOM increased by 23.3% but are still only at 37 days, which is much better than the condo market.
For YTD the trend is a bit different with number of sales being almost flat at 0.3% decrease while volume, average price, and highest price all have double digit increases; 10.2%, 10.5% and 36.8% respectively. Overall detached properties are selling 12.9% faster this year than YTD last year and sit at only 27 average DOM.
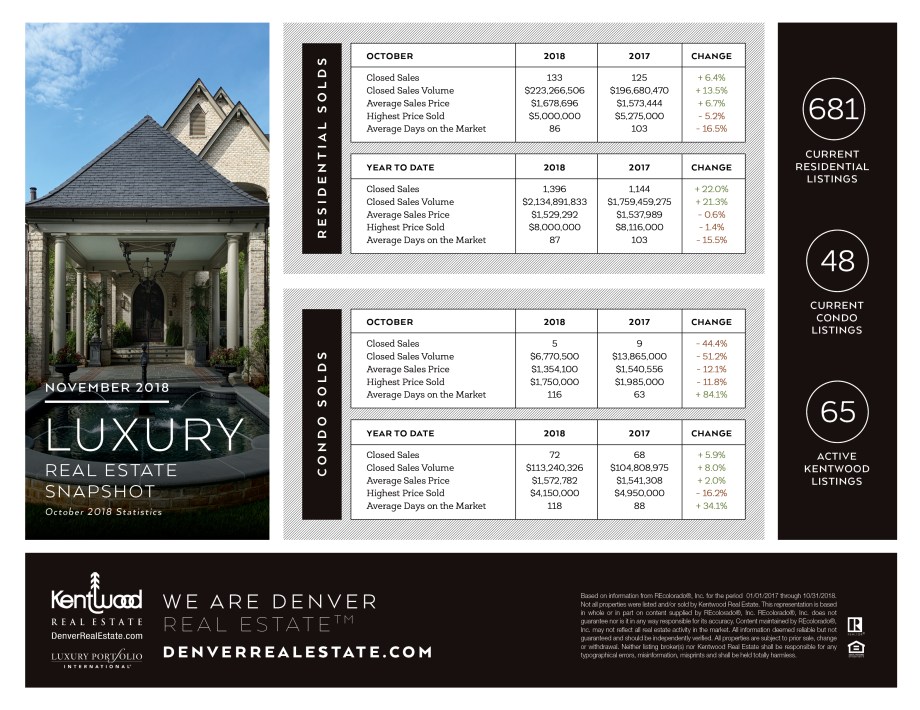
Luxury Real Estate
Denver is seeing the market flattening out overall but this does not apply to the Luxury Market. For residential solds there’s an increase in number of closed sales and volume, both looking at the month of October and year to date. For October closed sales were up 6.4%, volume 13.5% as well as a 6.7% in average sales price. Highest price sold was down just over 5% but DOM decreased by 16.5% with properties selling in an average of 86 days vs. 103 days a year ago.
Year to date figures show closed sales up 22% and volume 21.3%! Average price is pretty flat with a decrease of 0.6% and highest price sold is slightly down as well at 1.4%. Similarly to October, DOM are down, in this case by 15.5%.
Luxury condos however, paint quite a different picture. October shows a 44.4% decline in number of closed sales, and 51.2% decline in sales volume as well as a whooping 84.1% increase in DOM, which are now at 116 days. Average price was down by 12.1% and highest price sold by 11.8%.
It’s a different picture for condos YTD as while highest price sold is down 16.2% and DOM have increased from 88 to 118, the rest of the markers are up. Number of closed sales rose by 5.9%, volume by 8% and average price by 2%.
This shows us that the luxury condo market has been negatively impacted in October, while it remains strong for residential properties.
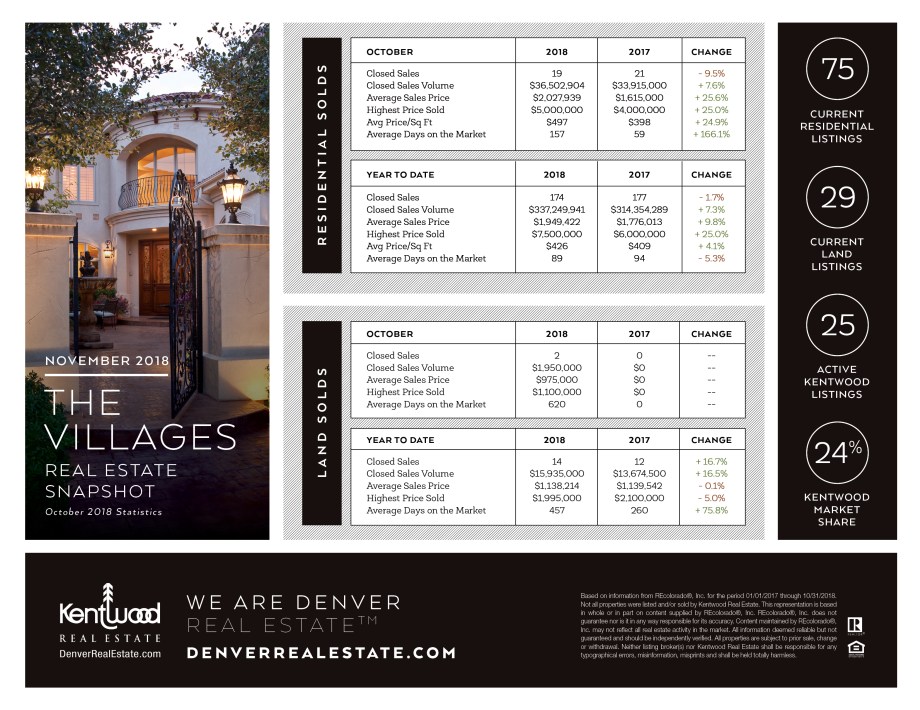
The Villages
The Villages continue to show a market quite different from what we’re seeing in the City of Denver and elsewhere in the metro area. For the month of October we saw a 9.5% decrease in number of sales, from 21 to 19, with sales volume up 7.6%. Average price increased by over 25%, highest price by 25%, and average price per square foot by 24.9%!! The only real negative here is that DOM increased from 59 to 157 or by 166.1%.
The year to date numbers show a very slight decrease of 1.7% for number of sales and a 7.3% increase in volume. Average price was up 9.8%, highest price by 25% and price per square foot by 4.1%. For YTD overall properties are selling 5.3% quicker than last year.
Land statistics are simple for the Villages for October as no land sold in October 2017. This year there were 2 sales for about a million dollars each and average DOM of 620.
For YTD, land sales and volume are up almost 17% and average price is stable at a 0.1% decrease. Highest price sold was down 5% and land DOM went from 260 last year to 457.
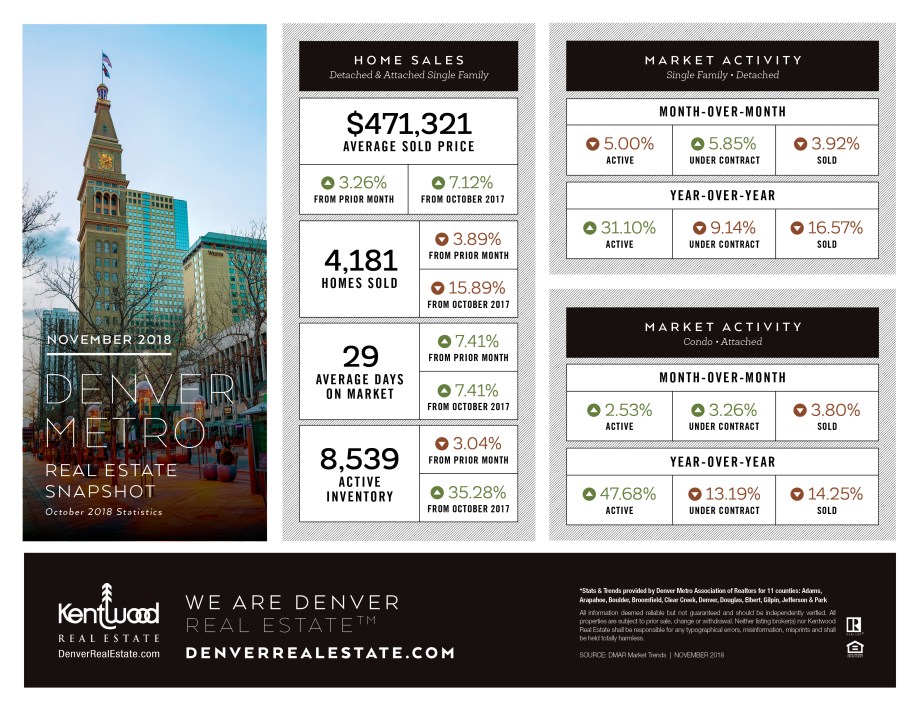
Denver Metro
The market for the Denver Metro area is flattening, which is evident by a decrease in number of homes sold, both from prior month and from October 2017, increase in DOM and a 35% increase in inventory from October 2017. However, properties are still selling in under a month, and average prices continue to rise; 3.26% from September, and 7.12% from October 2017.
Looking at YTD for both detached single family homes and attached properties there’s a huge increase in inventory with fewer properties going under contract and selling.