
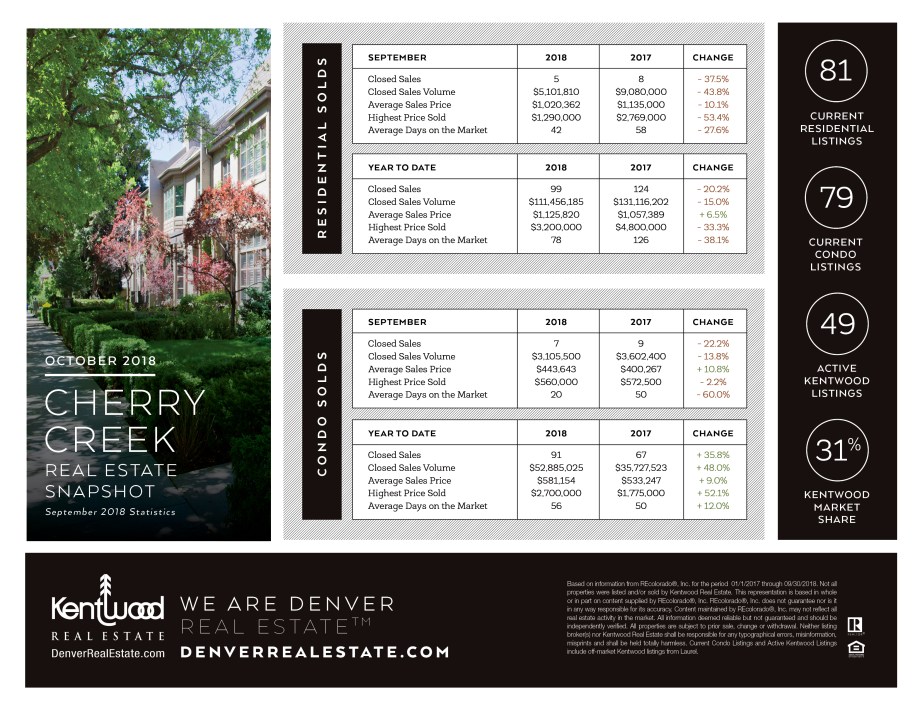
Cherry Creek
The Cherry Creek residential market showed much more than the typical seasonal slowdown. Looking at YOY for September there are significant decreases in every category with number of sales down by 37.5%, volume by 43.8%, average price decreased just over 10% and there was more than a 50% drop in highest price sold. Properties did sell almost 30% faster than same time last year, but that shouldn’t be a surprise as these numbers show a more favorable buyer’s market now.
Year to date for residential homes in Cherry Creek also shows a decline in closed sales and volume, but not as extreme as in September and average price is actually up by 6.5%. Like with September, highest price and DOM have decreased.
The condo market in Cherry Creek shows that properties were practically flying off the shelves this September with 20 average DOM vs. 50 last year. There were a couple of fewer sales and less volume, but average condo price is up 10.2% and there’s just a slight decline in highest price sold.
Looking at Cherry Creek condos YTD, there’s even more growth. Closed sales are up almost 36%, volume 48%, average price 9%, and highest price sold by over 52%! Condos did take 6 days longer to sell with DOM at 56 vs. 50 for YTD last year.
The City of Denver
September was interesting for attached properties. There was a nice increase of 9.1% in average price but properties took twice as long to sell, highest price dropped by half, and both closed sales and volume are down – 14.9% and 7.2% respectively.
The average price increase is about the same when we look at YTD, but as opposed to falling volume in September this year so far has had a 5.3% increase in volume compared to the same time frame in 2017. Number of closed sales are down 3.4%, highest price by just over 16% and properties are selling a bit slower with DOM increasing 21.4%
Detached properties in the City of Denver had 21.2% fewer sales in September YOY and 10.4% less volume. However, prices are up 12.6% and highest price by 33.3%. Days on market are the exact same as a year ago, or 37 days. This shows a pretty healthy seller’s market still in this category and fewer sales and volume could be due to little inventory.
2018 has been a good year so far for detached properties in Denver. The number of sales is almost flat at 0.3% growth, but volume is up 10.6% which goes hand in hand with an average price increase of 10.3%. Highest price is up 36.8% and DOM decreased by 16.1%, selling in about 3.5 weeks on average.

Luxury Real Estate
The residential luxury market showed an increase in all categories but not as extreme as we’ve been seeing in some other areas. Closed sales increased by 3.1% and volume by 3.1%, while average price is up 0.6%. Highest price sold showed an almost 19% increase, but properties are also selling at a slower pace with DOM up almost 25% to 96 days.
Year to date is not consistent with what we saw in September with number of sales having increased by 23.7% and volume by 22%. Both average price and highest price decreased by 1.4% and properties sold in 15.5% fewer days.
Overall the luxury market has performed well this year and remains pretty stable although it takes longer to sell properties now.
Luxury condos had a bad month in September compared to that of 2017. Only two properties sold, translating to a 77.8% decrease in number of sales and 81.4% in volume. Average price was down 16.3% and highest price by over 30%. Days on market increased by 53.2% and is now in the triple digits at 118 days.
If you are a buyer in the market for a luxury condo now is time to make a deal!!
Things are not quite so bleak looking at YTD with condo sales being up almost 12% and volume by over 15%. Average price showed a modest gain of 3.1% while highest price dropped by 16.2%. Like in September properties are taking longer to sell and DOM sits at 114 days for YTD.

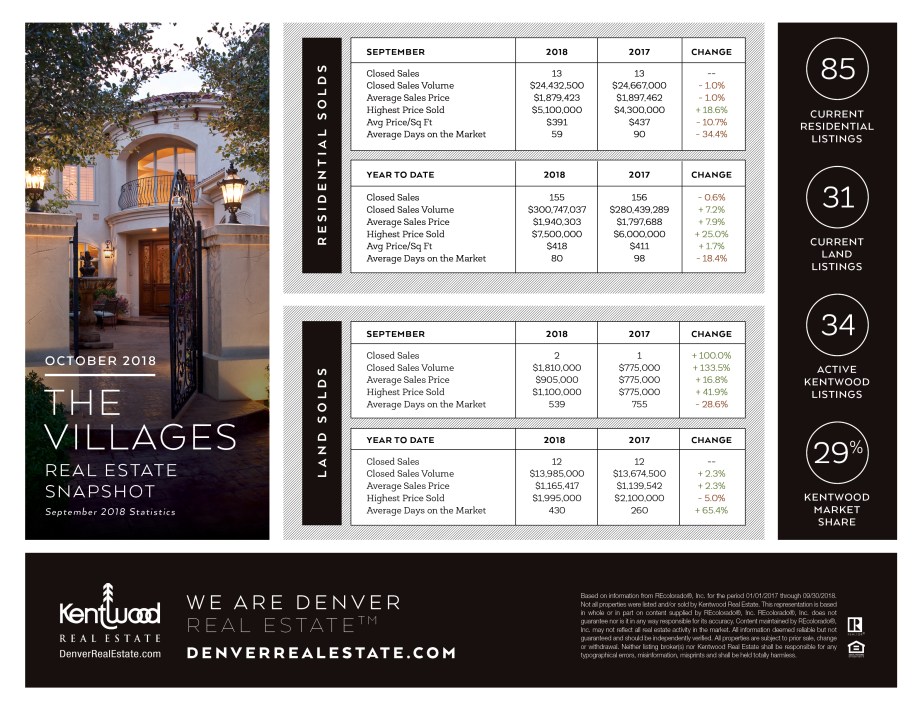
The Villages
The Villages had a pretty healthy month in September. Although price per foot is down 10.7%, highest price is up 18.6% and properties are now selling in 2 months vs. 3 a year ago. The number of sales was the exact same at 13 properties and volume and average price show a 1% decrease.
Year to date in the Villages shows a strong market as well. There has been just one fewer sale compared to last year, and volume is up 7.2% and average price by 7.9%. Highest price increased by 25% and price per foot by almost 2%. Days on market lowered by 18.4%.
Land in the Villages is always a bit tricky to evaluate on a monthly basis due to the low volume so while we see some big numbers for September that is also due to 2 sales this year vs. 1 sale in September 2017.
Year to date gives a better idea of the land market with closed sales being at 12 properties for both years. Volume and price both increased by 2.3% and highest price decreased by 5%. The largest change is that DOM increased by over 65%, which is not what we saw with the two properties that sold in September so that will be interesting to keep an eye on as we get closer to the end of the year.
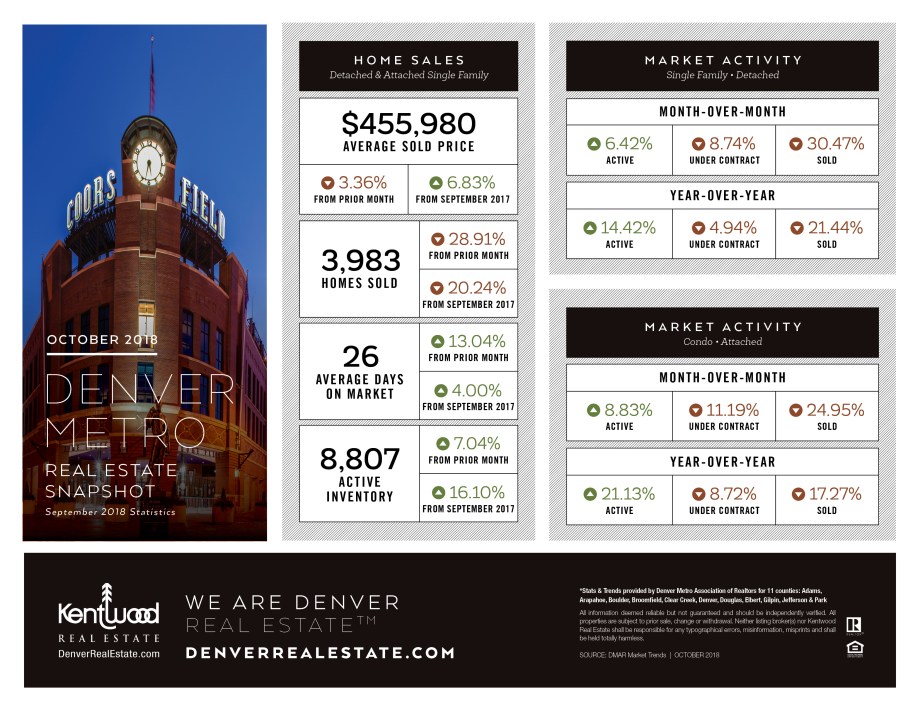
Denver Metro
While the average price decreased from August to September, which can be attributed to seasonality, it is up almost 7% from September 2017. Fewer homes have sold, both looking at YTD and September, with over 20% drop for both. At the same time average DOM are up and so is inventory so it’s a good time for buyers to get out there!
![]()
