
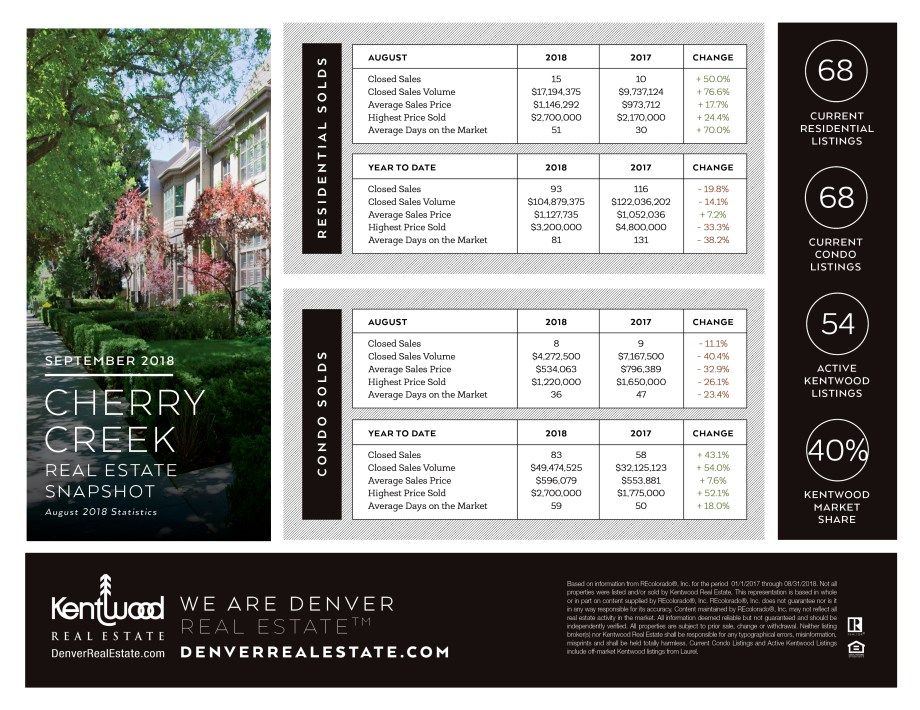
Cherry Creek
Residential properties for Cherry Creek show quite a different picture when comparing August vs YTD.
Looking at August this year compared to 2017, we are deep in green territory. Closed sales are up 70%, volume 76.6%, average price almost 18% and highest price is up over 24%!!! This is the complete opposite of what we saw for July.
However, properties stayed on the market a lot longer – DOM increased 70% from August 2017.
Looking at YTD, both number of closed sales and volume are down – 19.8% and 14.1% respectively. Average price though is up just over 7% but highest price is down a third from last year. The good news is that properties are moving faster with DOM going from 131 to 81.
This shows how slow the Cherry Creek market has been this year even though average price is up. Inventory is also plentiful. It signals that there are some good buys to be made right now in a neighborhood that remains very strong.
The condo market for Cherry Creek shows a completely reverse picture with August to August comparison in the red, but YTD comparison in the green.
Closed sales went down 11% but due to the low volume that means that actually only one less property sold August this year compared to that of 2017, but volume and price is down more significantly. Closed sales volume is down by 40.4%, average price 32.9%, and highest price by 26.1%. Average days on market went from 47 to 36.
Year to date for the Cherry Creek condo market has a large increase in number of sales and sales volume – 43.1% and 54% respectively. Average price is similar to that of the residential market for the same period; up 7.6%. Highest price sold follows the number of sales and volume in this case and is up 52.1% but properties are staying on the market longer being up 18%.
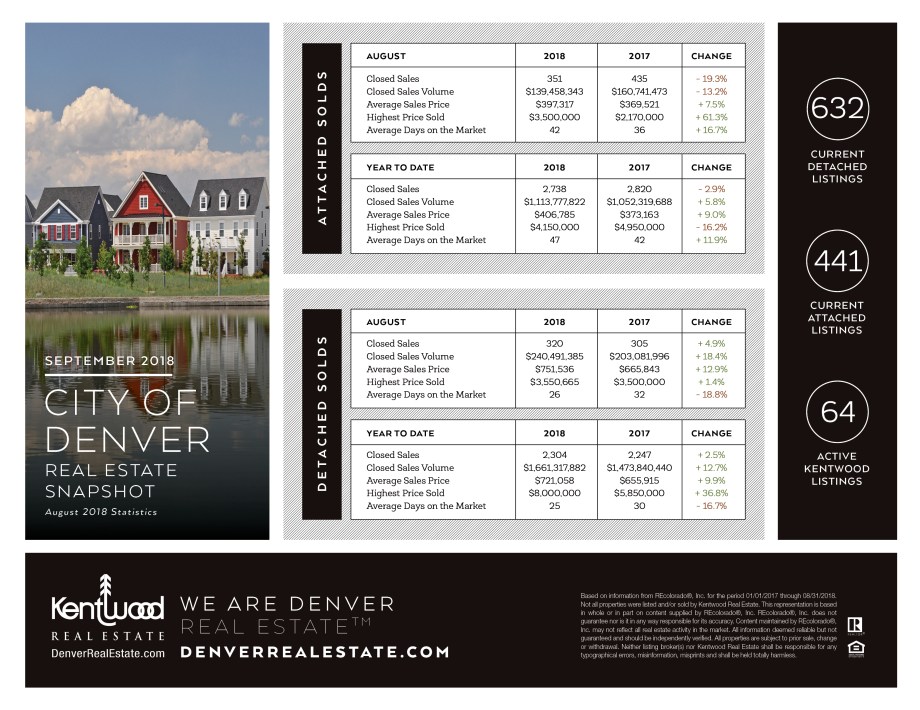
The City of Denver
Attached properties in the City of Denver had double digit slowdown for closed sales and volume for the month of August but a steady growth in average price of 7.5%. Highest price sold was up over 60% but properties are staying on the market 17% longer then August 2017.
Looking at year to date for the same category, closed sales are slightly down while volume is up 5.8%. Average price is up 9% while the highest price sold is down over 16%. Just like with August properties are not selling as fast with DOM increasing by almost 12%.
Detached properties in Denver performed well both looking at August and YTD. For August sales are up 4.9%, volume over 18% and average price increased by 12.9%. The highest price sold was almost flat but homes sold much faster than a year ago with DOM showing a decrease of 18.8%.
The City of Denver showed a similar trend for detached properties YTD with number of closed sales slightly up at 2.5%, sales volume increasing by almost 13%, average price by 9.9% and highest price sold by 36.8%! Similarly to August properties sold faster staying on the market an average of 25 days vs 30 a year ago.
Overall it shows a strong market for single family homes, which is great for sellers, but potentially better deals for buyers of attached homes.
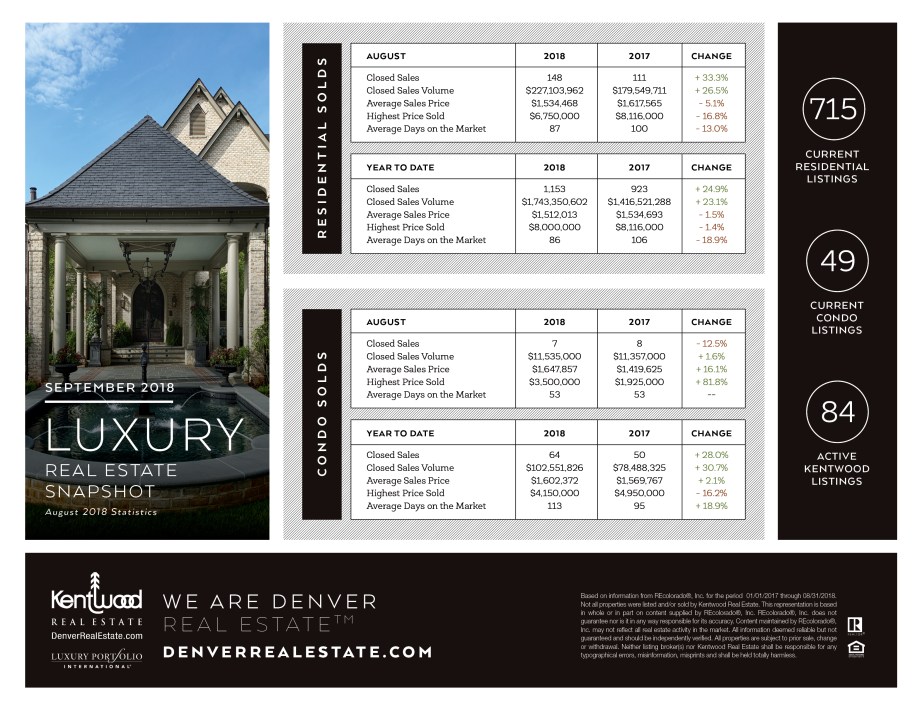
Luxury Real Estate
The residential luxury market shows a similar trend both for August over August comparison and YTD compared to 2017. Both the number of sales and sales volume are up significantly and properties are moving much faster while prices are down. This means that there are good deals to be made in the luxury market but buyer’s must act quickly!
Specifically, closed sales and sales volume are up 33.3% and 26.5% respectively for August while average price is down 5.1%, highest price by almost 17%, and DOM have decreased by 13%
Year to date has closed sales up 24.9% and sales volume by 23.1%. Average price and highest price decreased by 1.5% and 1.4% respectively. For YTD the decrease in DOM is even more than for August or 18.9%.
Luxury condos are a bit different than residential properties and August and YTD don’t show the same overall trend either.
For August the number of sales went from 8 to 7 in August 2018, with a slight increase of 1.6% for volume. Average price had a double digit growth of 16.1% and DOM remained at 53 days.
Year to date in the luxury condo market has a significant increase in both sales and volume; 28% and 30.7% respectively. Average price is up just over 2% while highest price decreased by 16.2%. Days on market are completely the reverse of the residential luxury market, or by 18.9%
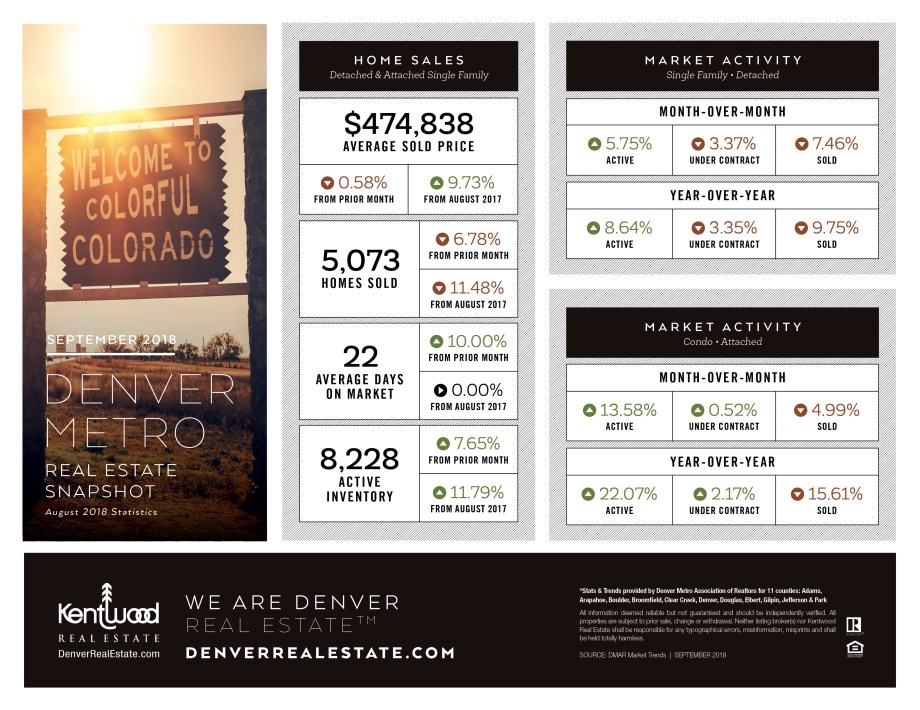
Denver Metro
The average price in Metro Denver is $474,838 which is a slight decrease from July, but almost 10% growth from August 2017. The number of homes sold is down, both compared to July and to a year ago. Average days on market remains low at 22 days but active inventory is up almost 8% from July, which isn’t that surprising as July tends to be a slow month, but it’s up almost 12% from August 2017.
The combo of decreasing numbers of homes sold and higher inventory continues to signal that the market is shifting to be more favorable to buyers.
The trend holds for both single family homes and condos, but it’s more extreme for condos.
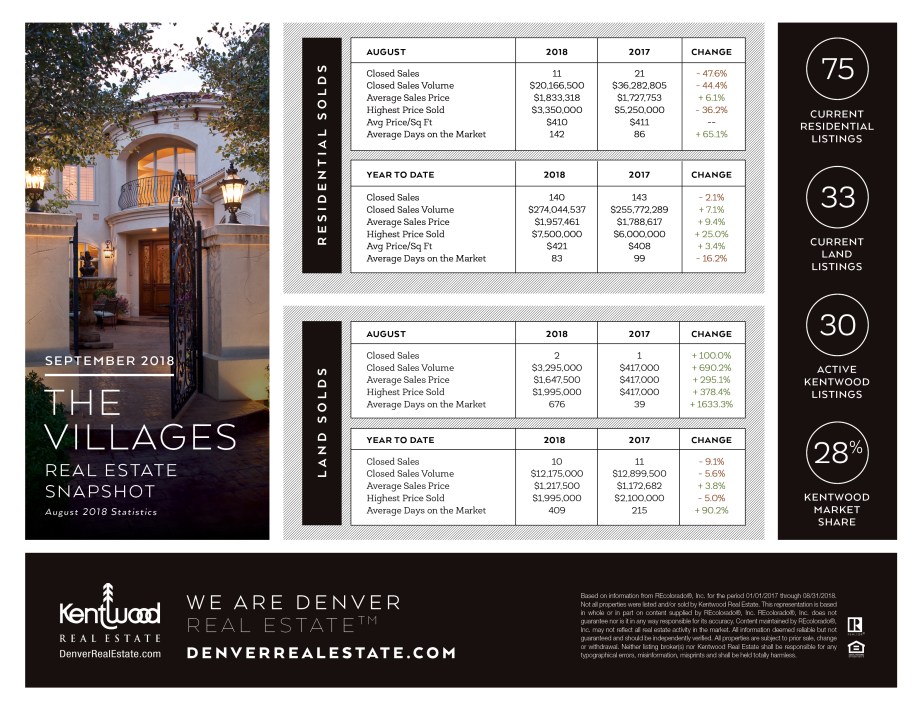
The Villages
The Villages numbers are interesting for residential properties for August. There’s a significant drop in both number of closed sales and volume, over 40% decrease for both, but average price is up by 6.1%. Highest price sold is down 36.2% but price per square foot remains virtually unchanged at $410. August was a slow month this year and average DOM went from 86 to 142.
Looking at YTD the numbers paint a different picture. Closed sales dropped just slightly by 2.1% while volume is up 7.1%. Average price has increased by 9.4% and highest price by 25%!
Average price per square foot is up 3.4% and properties are selling faster, staying on the market an average of 83 days.
Land in the Villages, as so often, shows some dramatic numbers for August, which is due to the low monthly volume – this time it went from 1 to 2 land sales.
Year to date saw closed sales decreasing by over 9% and volume by 5.6% while average price is up 3.8% and highest price decreased by 5%. Average DOM shows a dramatic increase with land now staying on the market for an average of 409 days!
Land aside, the Villages still show a seller’s market although it will be interesting to see what the September statistics will show compared to August.
![]()
